OMR Reviews
find out more"I have finally found a tool that allows me to embed videos on my website in compliance with GDPR and without additional cookies."
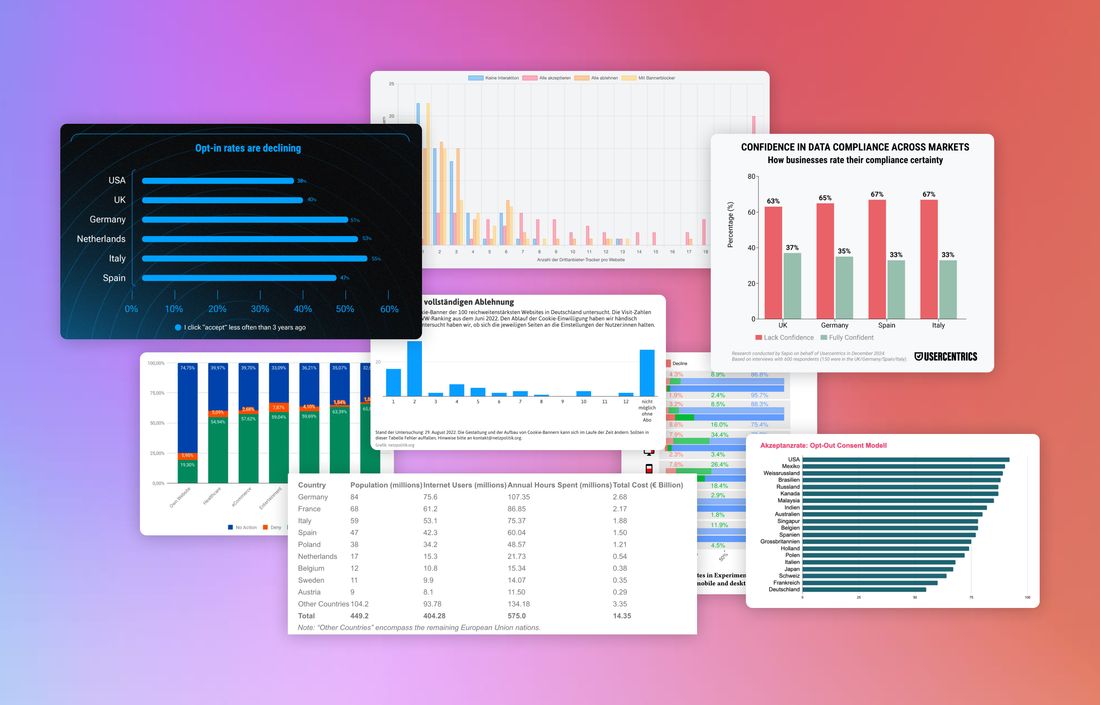
Cookie banners have now become standard on almost every website. But how users actually deal with them, what acceptance and rejection rates look like, and how many banners are truly GDPR-compliant often remain unclear. To bring more transparency to this, we’ve gathered and analyzed the most important studies from recent years.
In total, we’ve compiled 26 studies (last update: february 2026) that shed light on different aspects of cookie banners. Our focus was on the following questions:
Bottom line up front:
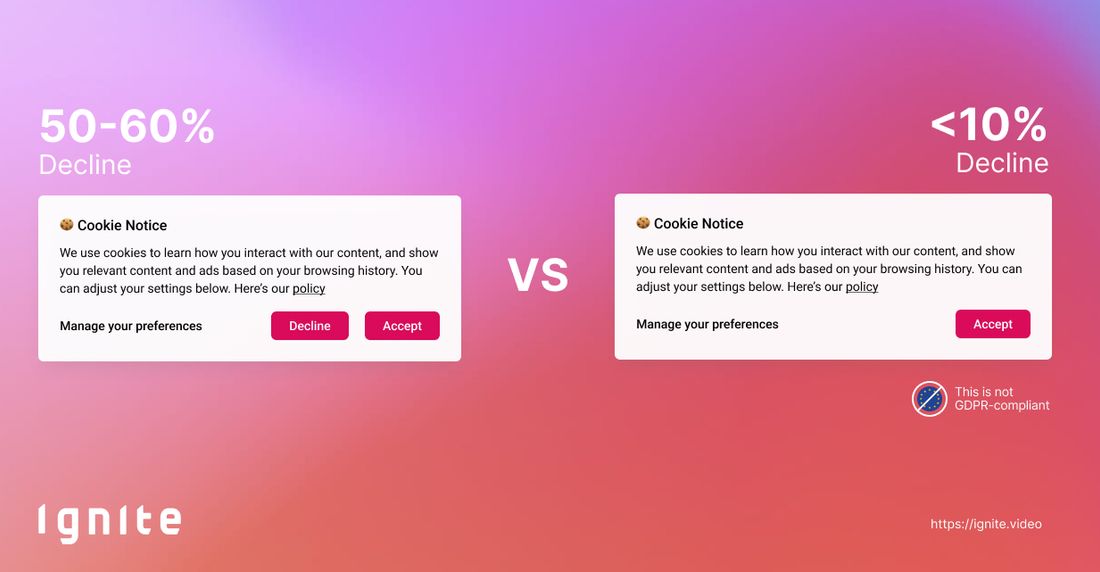
The numbers are clear. Users have no appetite for tracking. When they have a choice, 50–70% opt out. Still, many companies rig their banners so that “Reject” is hidden — and drive the rejection rate below 10%. Sometimes knowingly. Sometimes not. Users click “Accept” grudgingly. They feel pressured — and that feeling demonstrably erodes trust.
Compliant, fair banners aren’t a risk — they’re an advantage. They create transparency, strengthen brand trust, and show that you take your customers seriously.
Depending on the design, the rejection rate sits at around 50% to over 60% when a clearly visible “Reject all” button is offered on equal footing. But if rejecting takes multiple clicks, up to 90% of users end up accepting instead (2024 / Study No. 05; 2023 / Study No. 03; 2024 / Study No. 04).
The trend is clear: Back in 2018–2019, the majority clicked “Accept all” (60–90%), often because there were no real reject options. From 2021–2023, regulation and public debate pushed rejection rates up to 40–50% whenever users had a visible choice. In the latest data from 2024–2025, about half to two-thirds now reject when a proper “Reject all” button is offered.
(2019 / Study No. 02; 2020 / Study No. 01; 2022 / Study No. 01; 2024 / Study No. 05; 2025 / Study No. 01).
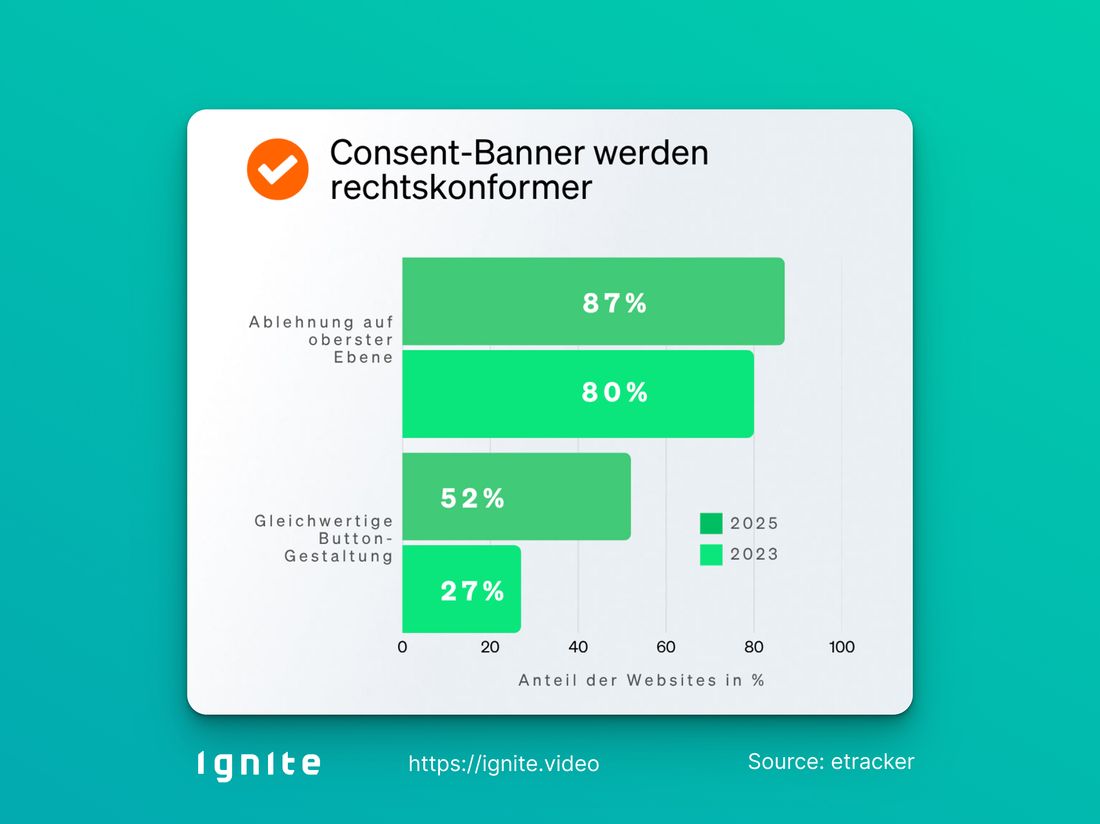
Depending on the study, the share of websites with an equally visible “Reject All” button ranges between 15% and 87%. There is very high variance depending on the study, country, and websites analyzed. The vast majority still hide the reject option on a second layer or do not offer it at all. In Germany, however, 52% of websites now provide an equally visible reject button.
(2025 / Study No. 03; 2025 / Study No. 04; 2024 / Study No. 05; 2022 / Study No. 03).
Two factors stand out: the user’s intent when visiting a website, and the design of the banner. People who come with a clear goal, like making a purchase or getting quick access to content, are more likely to accept cookies, even if they have privacy concerns. At the same time, banner design has a major impact: when “Accept” and “Reject” are equally visible, rejection rates rise significantly.
Moreover, many people have strong cookie preferences before they even see a banner. In one experiment, 37% always accepted and 26% always rejected. Only about one-third switched, depending on design and context.
(2021 / Study No. 01; 2023 / Study No. 03; 2024 / Study No. 04; 2024 / Study No. 05: 2025 / Study No. 5).
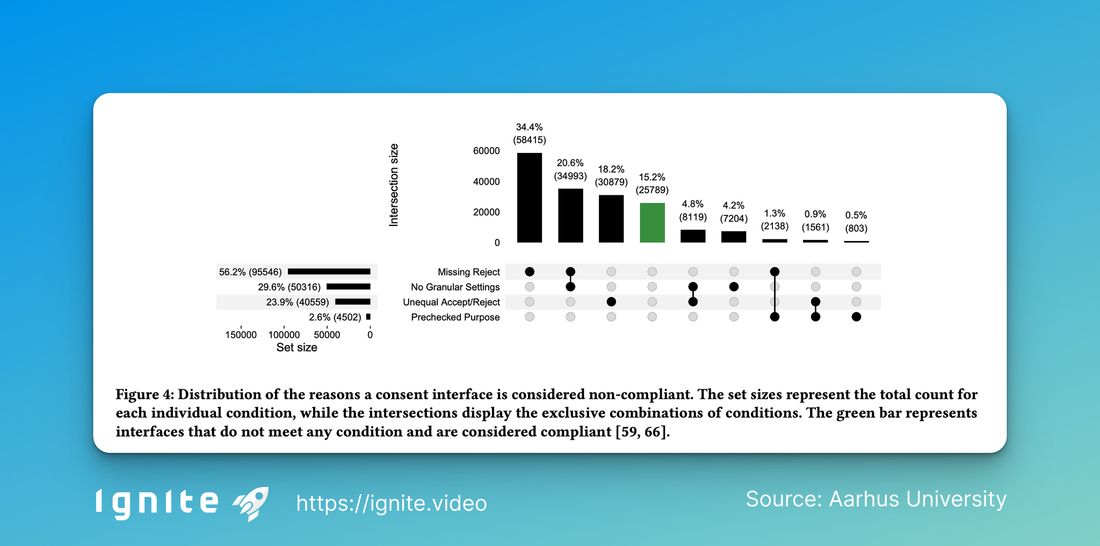
Research makes it clear: most websites do not follow the rules when it comes to cookie banners. One analysis of over 35,000 European websites found that 49% were in violation. An international study of 254,148 websites across 31 countries showed that only 15% of cookie banners even met the minimum requirements. Analyses of 20 million interactions with consent management platforms also revealed that over 50% of websites set cookies before users had made any choice at all.
Even “compliant” banners that include a reject button often use dark patterns. A 2025 study finds that 38% of compliant banners still make the accept button the main visual focal point.
(2019 / Study No. 01; 2022 / Study No. 04; 2023 / Study No. 02; 2025 / Study No. 03; 2024 / Study No. 05; 2025 / Study No. 9).
High rejection rates mean that much of the data needed for marketing and optimization is lost — studies report 40–70% fewer tracking data points when a real “Reject all” option is available. This directly impacts KPIs such as reach, audience profiling, and conversion.
Even more problematic: many users do consent, but only to unlock blocked content like videos or maps. Studies refer to this as “consent under duress” — acceptance under pressure. Users experience this as unfair and frustrating, which undermines trust in the website and brand.
It’s especially noticeable with content that is technically tied to consent (e.g., YouTube, Vimeo, Google Maps, social media widgets).
(2022 / Study No. 01; 2024 / Study No. 04; 2025 / Study No. 01)
Does clicking “Reject” in a banner really solve the problem? The studies clearly suggest no, because tracking often still starts technically. Even when users reject or when no valid consent exists, 43% of websites still set tracking cookies. Together with the high share of non-compliant websites, the picture is clear. As a visitor, you typically have no real way to avoid tracking.
Google alone accounts for 47.3% of pixel-tracking violations without valid consent. Meta follows with 8.8%. When so few players dominate common tracking stacks, they indirectly shape what site operators implement and how well they technically link tracking to consent, even though responsibility remains with the websites.
(2025 / Study No. 6)
While giving consent later usually works reliably, going the other direction typically does not. 57.5% of websites do not delete cookies after revocation. In those cases, withdrawing consent has no real effect.
What works even worse: When you accept, you typically also allow tracking by external vendors. If you revoke, those vendors must receive the signal; otherwise, their tracking can continue. Three out of four websites fail to do this correctly and do not properly notify at least one third party upon revocation. As a result, tracking can continue even after you revoke.
(2025 / Study No. 8)
Here you’ll find the studies we’ve discovered so far — sorted by publication year, not by relevance or scope. If you know of newer ones, send them our way.
Our focus is on European research, though a few international studies are included. For detailed questions, please contact the respective authors directly.
Important: Acceptance or rejection rates can’t be calculated in a one-size-fits-all way. They depend heavily on
As a rule of thumb: the more compliant and fair the banner, the higher the rejection rate — because it makes it especially easy for users to say “no.”
Quick disclaimer: we reviewed, analyzed, and summarized over 20 studies. We did this very carefully, but it was a lot of data. If you spot a transposed number anywhere, please let us know. Thanks.
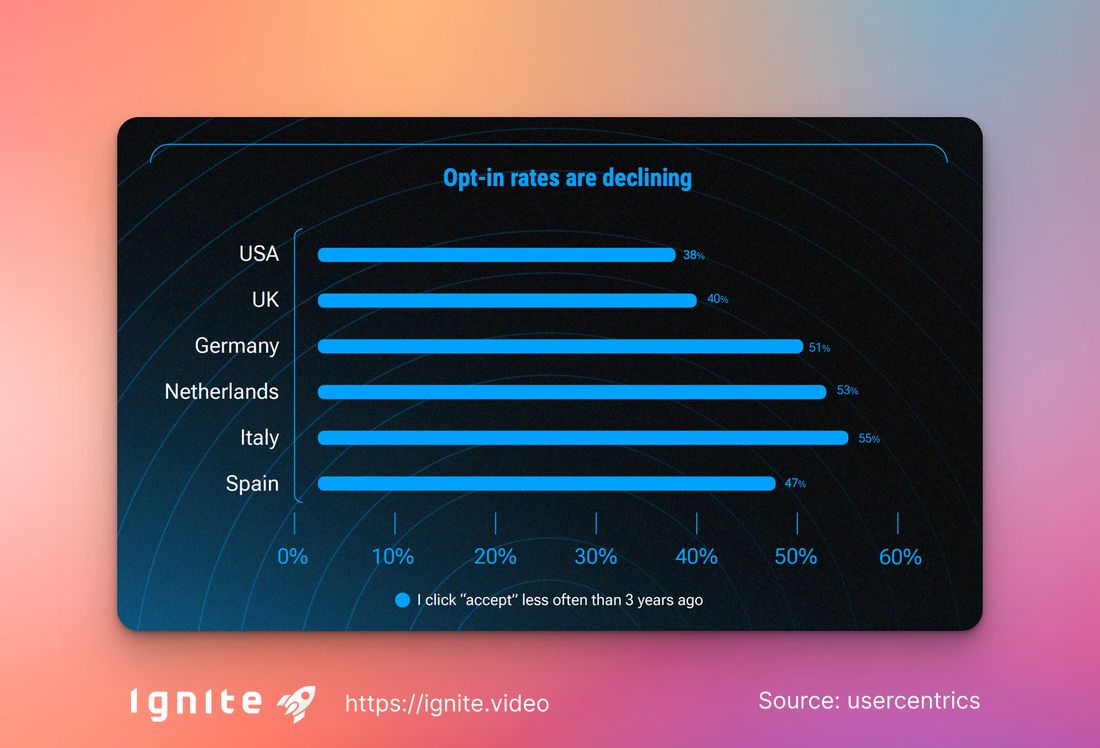
(2025 / Study No. 01)
Subject of the study:
Perceptions of privacy, consent banners, and digital trust in the age of AI and Big Tech.
Scope:
Survey of 10,000 internet-savvy consumers in Europe (Germany, Italy, Spain, Netherlands, UK) and the US.
Key findings:
Source:
Usercentrics / Sapio Research (May 2025) https://usercentrics.com/de/resources/state-of-digital-trust-report/
(2025 / Study No. 02)
Subject of the study:
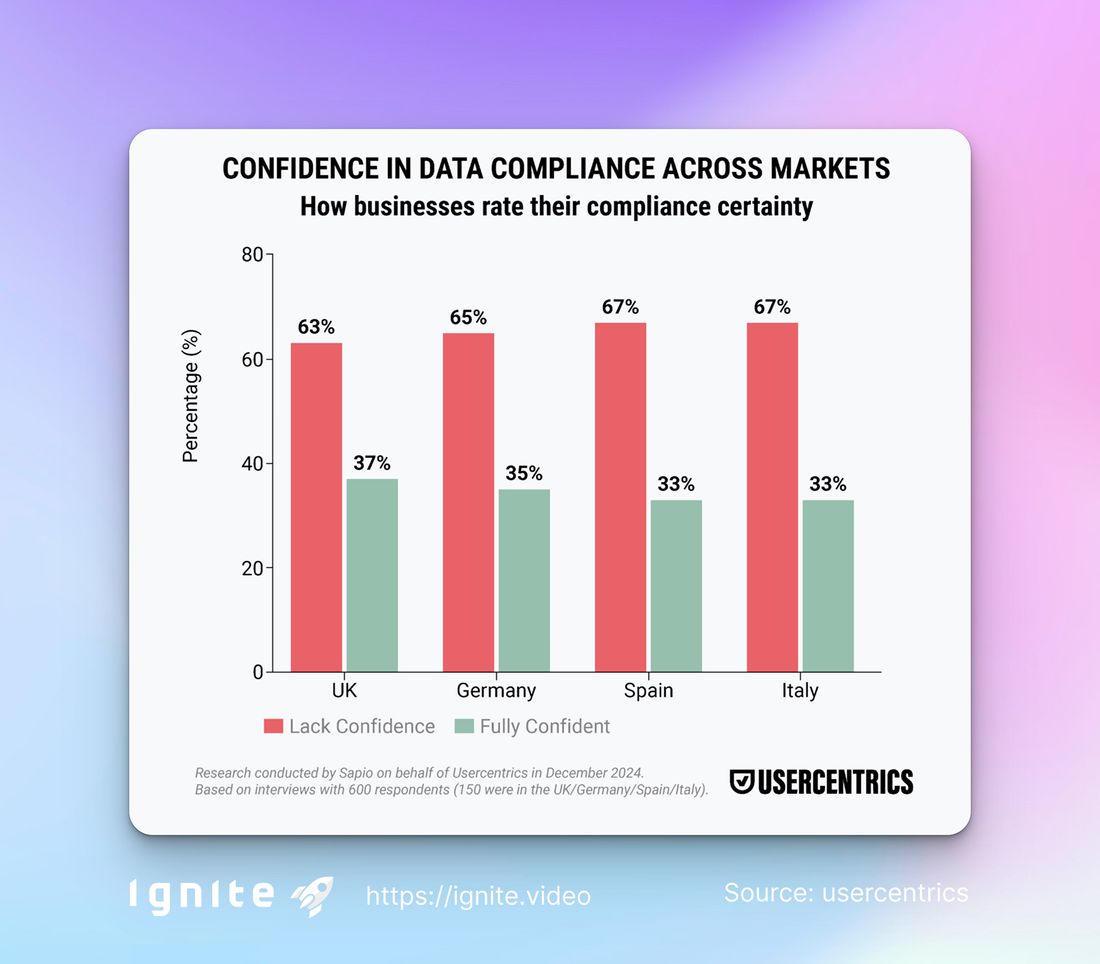
Assessment by European companies of their compliance with data protection laws and cookie banner requirements.
Scope:
Survey of 600 decision-makers in the UK, Germany, Spain, and Italy (150 each).
Key findings:
Source:
Usercentrics / Sapio Research (Dec. 2024 – publication March 2025) https://usercentrics.com/press/usercentrics-research-european-businesses-doubt-their-data-compliance/
(2025 / Study No. 03)
What was analyzed:
Large-scale study on the design, prevalence, and compliance of cookie banners in Europe.
Scope:
Analysis of 254,148 websites from the top 10,000 in 31 EU countries and the UK.
Key findings:
"Caught up in the narrative that better interfaces are the answer, we risk losing sight of the fact that disempowerment is not a design flaw, but an inherent feature. The law does not require it–consent in EU law is a last-resort when no other legal basis can be established, not an important prerequisite. Because online tracking cannot be legalised in any other way in Europe, the industry response to a de facto legal prohibition has been to use design to stretch consent to and beyond its conceptual limits."
Source:
A Cross-Country Analysis of GDPR Cookie Banners (2025, Aarhus University)
(2025 / Study No. 4)
Subject of the study:
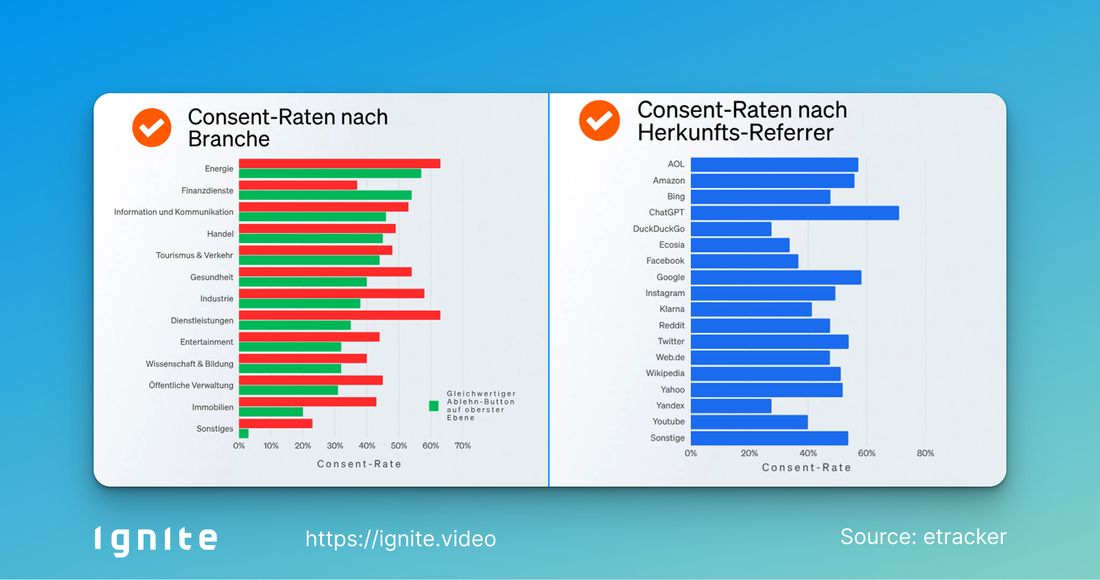
Analysis of consent rates and legal compliance of cookie banners.
Sample:
500 German websites with consent banners, data up to May 2025.
Key findings:
Source:
etracker (2025), Consent Benchmark Report 2025 https://www.etracker.com/app/uploads/2025/07/etracker-Consent-Benchmark-2025.pdf (GERMAN!)
(2025 / Study No. 5)
Research focus:
How strongly highlighting “Accept” or “Reject” changes cookie decisions. Also examines the role of personal attitudes and age.
Scope:
Online experiment with 306 participants. Each participant saw 12 website templates, each with a cookie banner.
Key findings:
Source:
Accepting cookies: Nudging, deceptive patterns and personal preference. (2025) https://www.sciencedirect.com/science/article/pii/S0747563225000883
(2025 / Study No. 6)
Research focus:
How often websites deploy tracking techniques under the GDPR without a valid consent signal. Covers tracking cookies, pixel tracking, and browser fingerprinting.
Scope:
Automated analysis of over 1 million websites from the Tranco list. Data collection in July 2024. Sites were also classified into 22 content categories using AI.
Key findings:
Source:
Large-scale web tracking and cookie compliance: Evaluating one million websites under GDPR with AI categorization. (2025) https://www.sciencedirect.com/science/article/pii/S1084804525001195
(2025 / Study No. 7)
Research focus:
How online shops set cookies and which tracking patterns emerge. Focus on “Masquerading Cookies”.
Scope:
Analysis of 360 popular e-commerce websites. 44,323 cookies analyzed.
Explanation:
Key findings:
Source:
Crumbled Cookies: Exploring E-commerce Websites’ Cookie Policies with Data Protection Regulations. https://dl.acm.org/doi/full/10.1145/3708515
(2025 / Study No. 8)
Research focus:
How easy it is to revoke consent on websites. And whether websites actually stop tracking afterward, delete cookies, and notify third parties.
Scope:
Audit of Tranco Top-200 websites. Additional analysis of 281 websites using IAB TCF or OneTrust to check what happens technically after revocation.
Key findings:
Source:
Johnny Can’t Revoke Consent Either: Measuring Compliance of Consent Revocation on the Web (2025) https://hal.science/hal-05474344/
(2025 / Study No. 9)
Research focus:
How often cookie banners that are classified as fully GDPR-compliant still visually steer users toward consent. Measures “aesthetic manipulation”, meaning which button draws the most attention.
Scope:
Analysis of 2,579 websites. EU vs non-EU comparison. Also tests whether EU websites change banner design depending on user location, EU vs US.
Key findings:
Source:
Using Salient Object Detection to Identify Manipulative Cookie Banners that Circumvent GDPR (2025) https://arxiv.org/abs/2510.26967
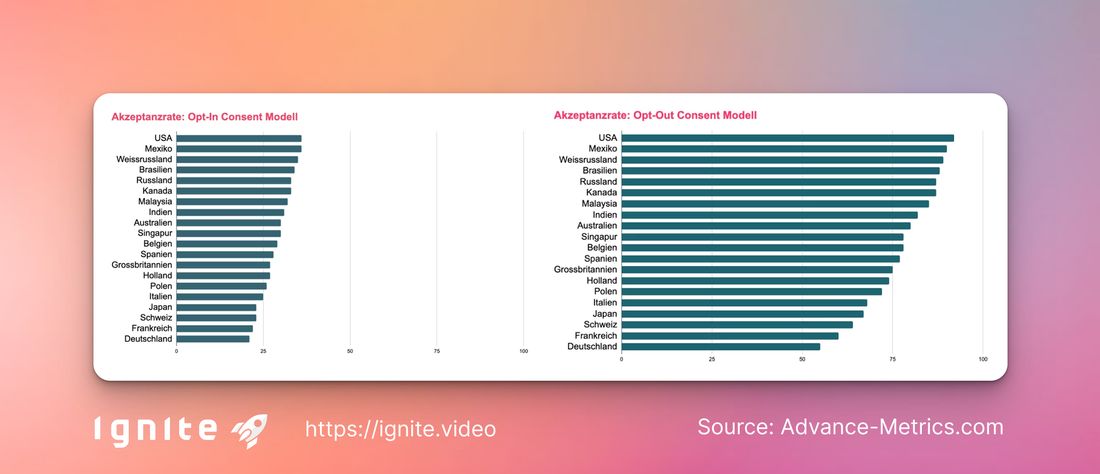
(2024 / Study No. 01)
Subject of the study:
Changes in user behavior with cookie banners between 2018 and 2023.
Scope:
Analysis of over 1.2 million user interactions on international B2B websites (services, industry, trade).
Key findings:
Country comparison:
Source:
Advance Metrics, Cookie-Banner-Stury (2024, Comparison 2018–2023) https://www.advance-metrics.com/de/blog/cookie-banner-verhaltensstudie/
(2024 / Study No. 02)
Subject of the study:
Attitudes and frustration levels of German internet users toward cookie banners and tracking notices.
Scope:
Representative survey of 1,013 participants aged 16 and above in Germany.
Key findings:
Source:
https://bitkom-research.de/news/drei-viertel-sind-von-cookie-bannern-genervt
(2024 / Study No. 03)
What was studied:
Technical analysis of browser tools that automatically interact with cookie banners (I don’t care about cookies, Consent-O-Matic, Ninja Cookie, SuperAgent, CookieBlock). Goal: to assess how these tools affect user privacy and GDPR compliance.
Scope:
Tests with 9 browser profiles across tens of thousands of websites. Measurements focused on the impact of the tools on cookies set, HTTP requests, and tracking behavior.
Key findings:
Source: https://petsymposium.org/popets/2024/popets-2024-0002.php
(2024 / Study No. 04)
Subject of the study:
Impact of different cookie banner designs (dark patterns vs. transparent “bright patterns”) on user acceptance and rejection.
Scope:
Online experiment with 3,947 participants in France.
Key findings:
Source:
Bielova et al., USENIX Security Symposium (2024, in Cooperation with CNIL) https://www.usenix.org/conference/usenixsecurity24/presentation/bielova
(2024 / Study No. 05)
Subject of the study:
Development of consent management platforms (CMPs) in Europe, their prevalence, and their compliance with GDPR.
Scope:
Long-term analysis of websites between 2015 and 2023, focusing on EU domains.
Key findings:
"For instance, over 60% of users do not consent when offered a simple “one-click reject-all” option. Conversely, when opting out requires more than one click, about 90% of users prefer to simply give their consent. The main objective is in fact to eliminate the annoying privacy banner rather the make an informed decision."
Source:
Longitudinal Analysis of Consent Management Platforms in the EU (2015–2023, Published 2024)
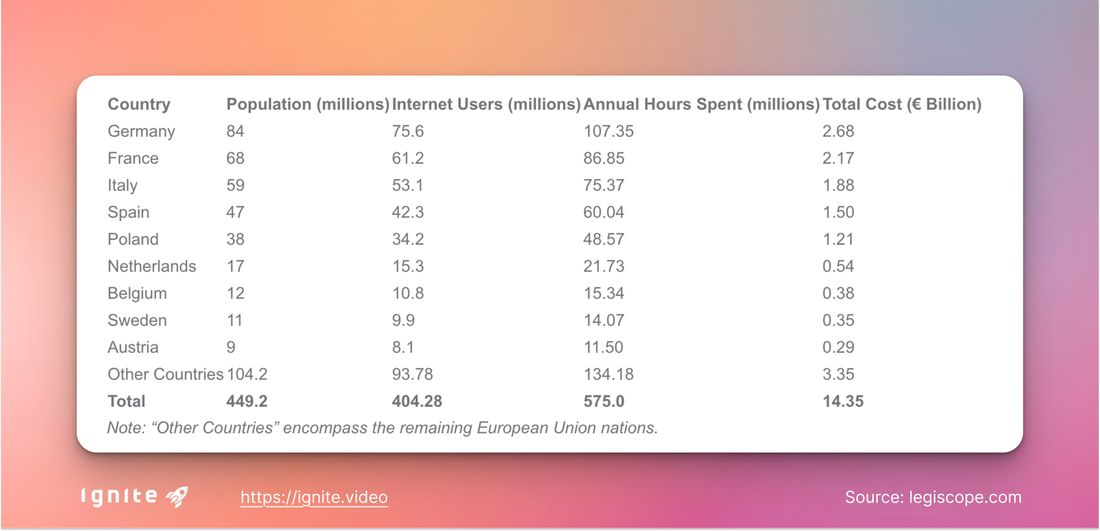
(2023 / Study No. 01)
What was studied:
How much time European internet users waste each year on cookie banners — and the resulting productivity losses.
Scope:
Analysis of user interactions in several European countries.
Key findings:
Source: https://legiscope.com/blog/hidden-productivity-drain-cookie-banners.html
(2023 / Study No. 02)
Subject of the study:
Geographical differences and user interactions with cookie banners on the world’s most visited websites.
Scope:
Analysis of the global top 10,000 websites.
Key findings:
Source:
Exploring the Cookieverse: A Multi-Perspective Analysis of Web Cookies (2023)
(2023 / Study No. 03)
Subject of the study:
Psychological and technical evaluation of how different banner designs (neutral, dark patterns, bright patterns) influence user decisions.
Scope:
Online experiment with 4,000 adults in France.
Key findings:
Source:
La DITP & CNIL: Impact of Cookie Banner Design (2023)https://www.modernisation.gouv.fr/publications/la-ditp-mesure-limpact-du-design-des-bannieres-cookies-sur-les-internautes
(2023 / Study No. 04)
What was studied:
How widespread are cookie banners that force users to choose: either accept cookies or pay for ad-free access?
Scope:
Analysis of around 45,000 websites worldwide, with a focus on news outlets and content portals.
Key findings:
Quelle:
https://arxiv.org/abs/2310.01108
(2022 / Study No. 01)
Subject of the study:
Long-term analysis of cookie practices on French websites — especially regarding third-party tracking and the effects of CNIL enforcement measures.
Scope:
Monitoring of the 1,000 most visited French websites between January 2021 and August 2022 using the CookieViz tool from CNIL’s Digital Innovation Laboratory (LINC). The study examined the use of third-party cookies before any user interaction.
Key findings:
Limitation:
The study does not assess GDPR compliance of banners or consent design, but only the technical practice (cookie usage) at first visit.
Source:
(2022 / Study No. 02)
Subject of the study:
Attitudes of internet users in Germany toward cookies and cookie banners.
Scope:
Representative survey of 1,001 people aged 18 to 69 (Nov. 2022).
Key findings:
Source:
Net.ID / INNOFACT-Studie (2022) https://www.horizont.net/medien/nachrichten/studie-der-net.id-so-viele-internet-user-stoeren-sich-an-cookies--oder-an-den-cookie-zustimmungsbannern-204514 (paywall)
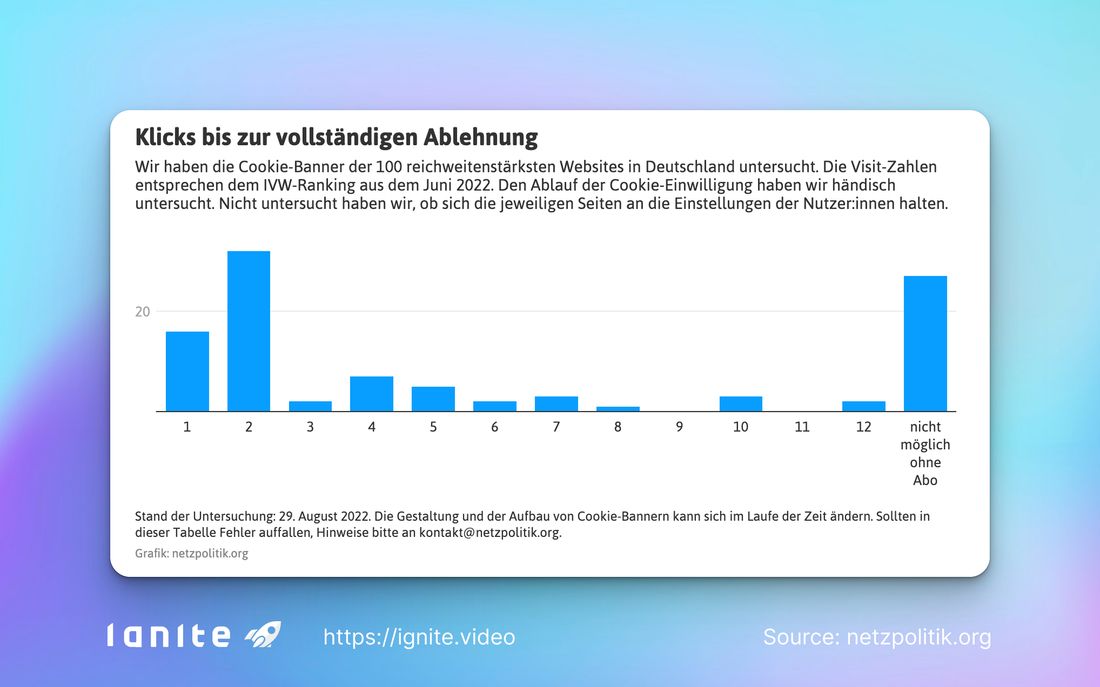
(2022 / Study No. 03)
Subject of the study:
Design and user-friendliness of cookie banners on the 100 most visited websites in Germany.
Scope:
Systematic review based on the IVW ranking, August 2022.
Key findings:
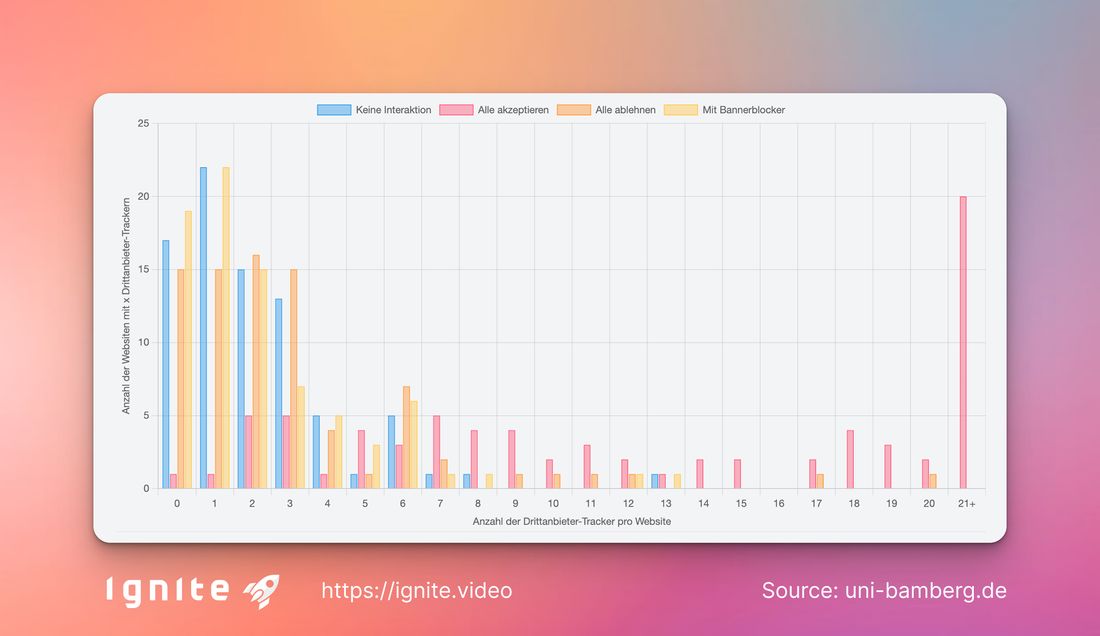
(2022 / Study No. 04)
Subject of the study:
Technical effectiveness of cookie banners on German-language websites and their GDPR compliance.
Scope:
Analysis of 81 websites with cookie banners (from a random sample of 100 German domains).
Key findings:
Source:
Tracker-Scan-Studie, University Bamberg (2022)
(2021 / Study No. 01)
Subject of the study:
Psychological and design factors influencing cookie decisions in the EU.
Scope:
Online survey with 132 EU users.
Key findings:
Source:
Cookies ’n’ Consent: An Empirical Study on the Factors Influencing Website Users’ Attitudes towards Cookie Consent in the EU (2021)
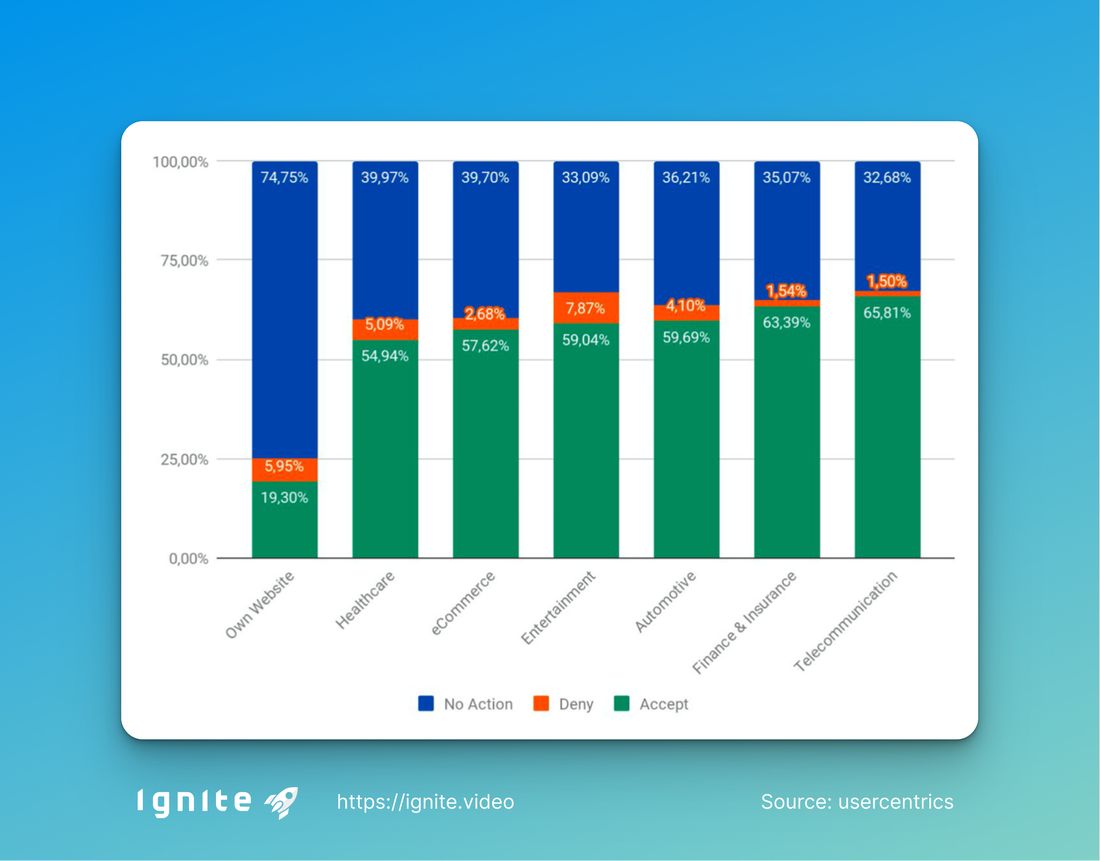
(2020 / Study No. 01)
What was studied:
Cookie acceptance rates across different industries — and what this means for data-driven marketing.
Scope:
Analysis of websites from various sectors, based on data from Usercentrics.
Key findings:
Note: Most websites today no longer allow users to simply not interact. “No action” is hardly an option anymore.
Quelle: https://www.verdure.de/magazin/technologie/cookies-akzeptanzrate-consent-marketing-zustimmung/
(2019 / Study No. 01)
What was analyzed:
Examination of whether cookie banners using the IAB Europe Transparency & Consent Framework (TCF) actually respect user choices and comply with the law.
Scope:
Analysis of 1,426 websites with TCF banners (out of a total of 22,949 crawled European websites). Detailed legal and technical review for GDPR and ePrivacy violations.
Key findings:
Quelle: https://arxiv.org/abs/1911.09964
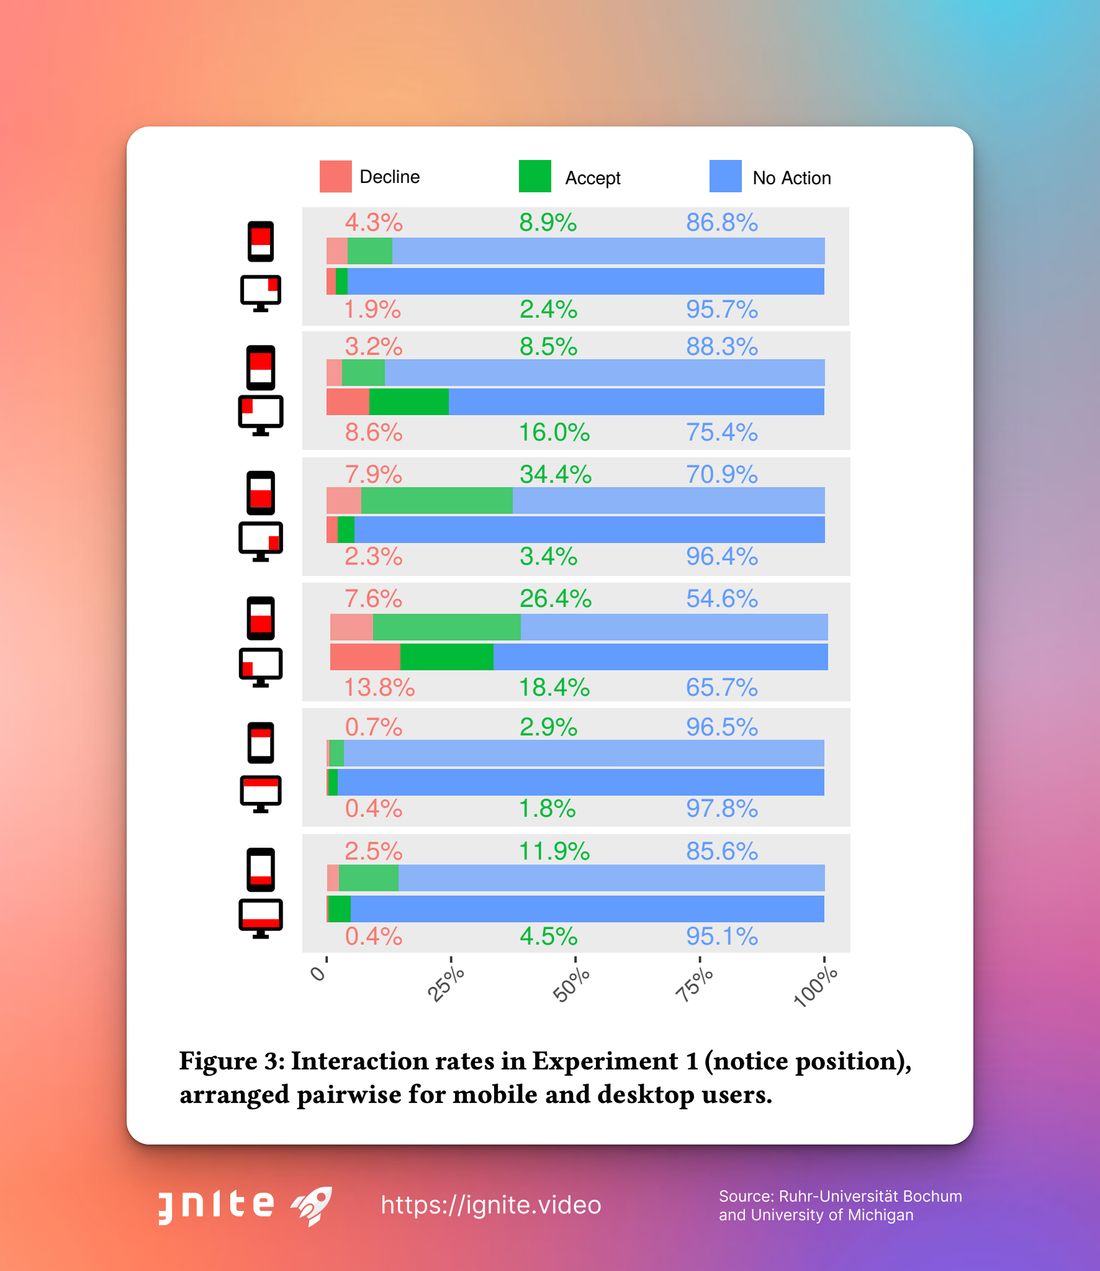
(2019 / Study No. 02)
Subject of the study:
Impact of banner design (position, wording, nudging, preselection) on cookie decisions.
Scope:
Three field experiments with over 80,000 real website visitors on a German e-commerce site.
Key findings:
Source:
Study of the Ruhr-Universität Bochum and the University of Michigan (2019) https://dl.acm.org/doi/10.1145/3319535.3354212
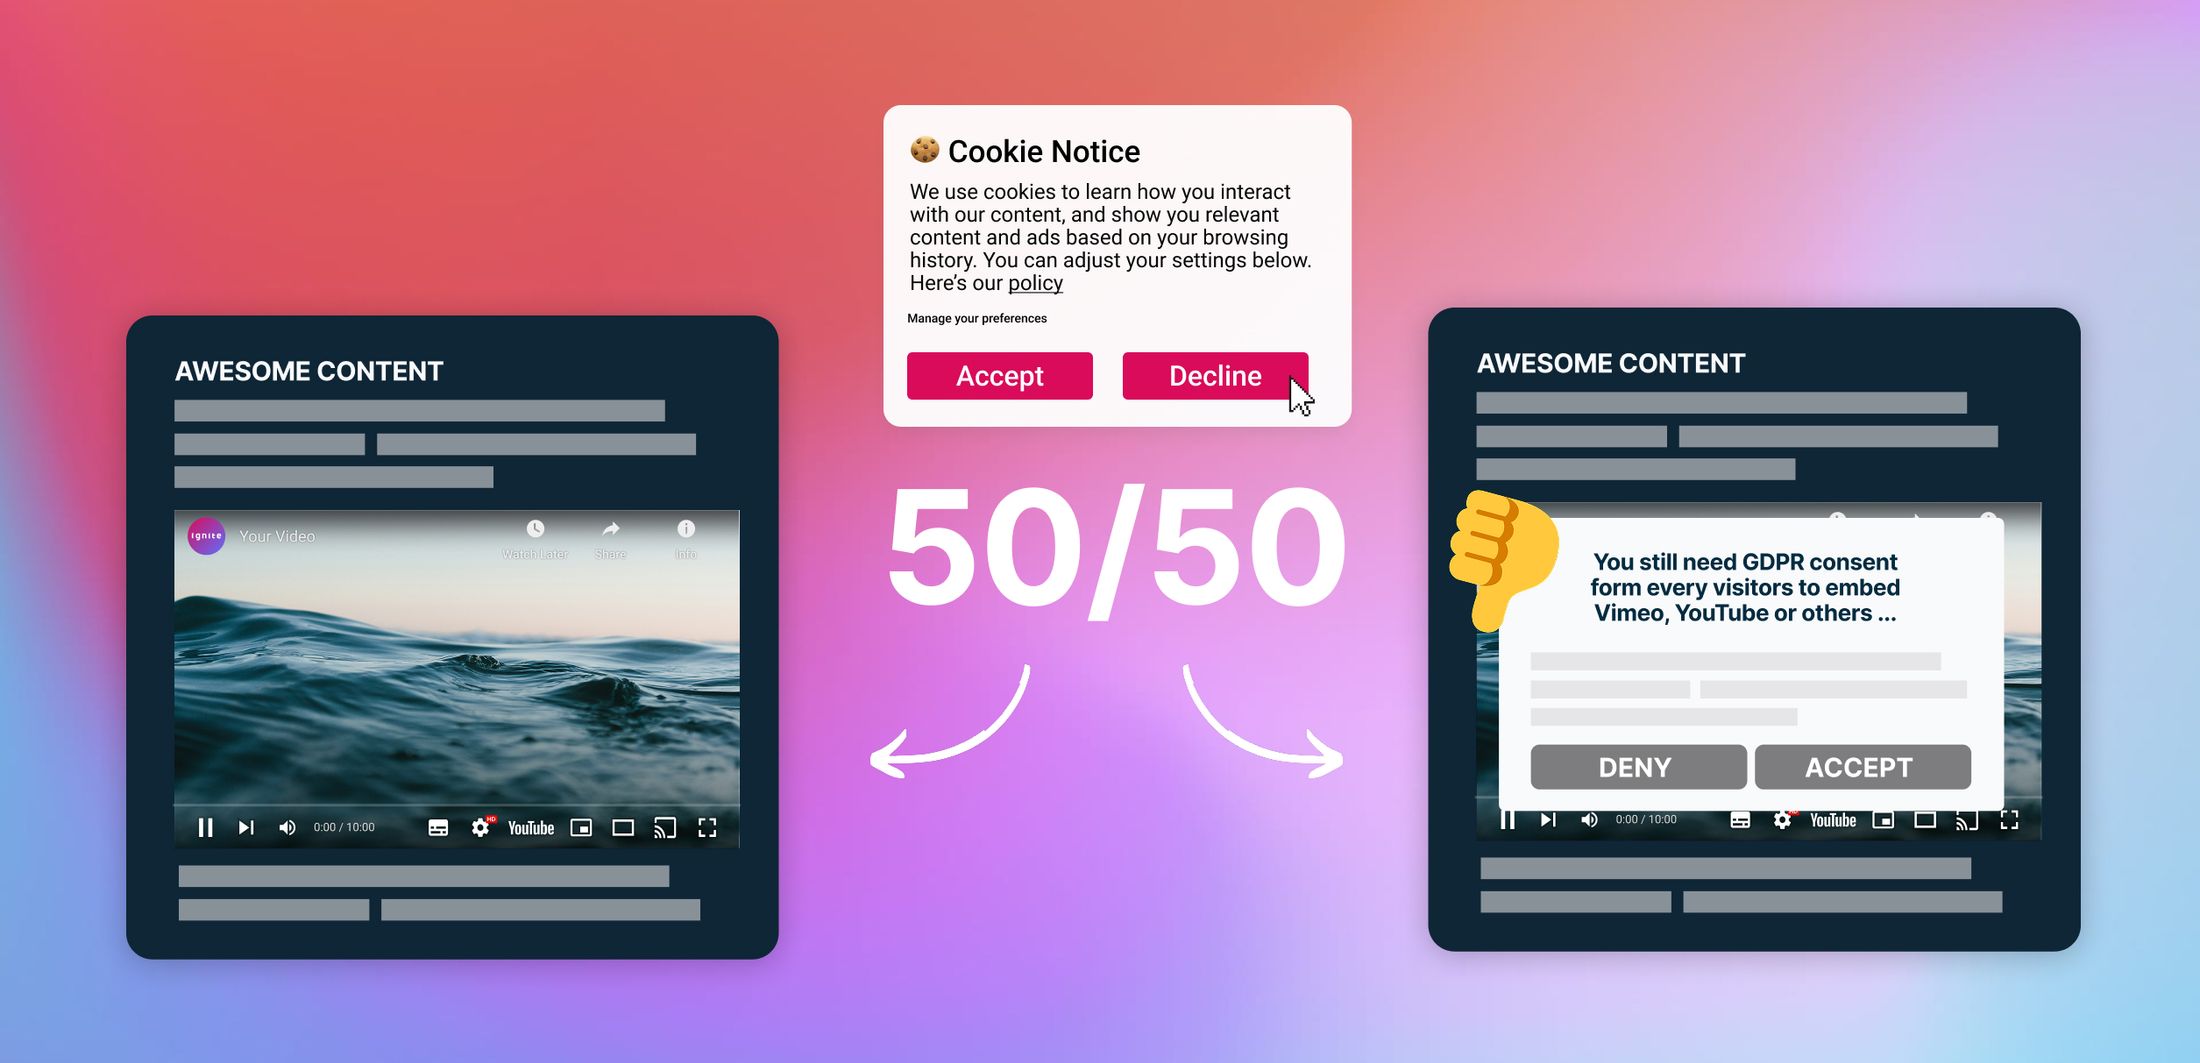
Everyone claims to be GDPR compliant. Of course. But all this really means is you need your visitors' consent. In practice, you integrate the video provider into your consent management platform, and your visitors may agree via the cookie banner. The catch? Depending on the website and the effectiveness of the cookie banner, only 30-60% of visitors consent . For the rest, all video content must either be removed by the provider or hidden behind a so-called "two-click solution."
Put simply: every other visitor doesn’t see your video.
You're looking for a solution that delivers your videos to all visitors while being more than GDPR-compliant: cookie and consent free, like Ignite Video.
